5 features of an effective data wall
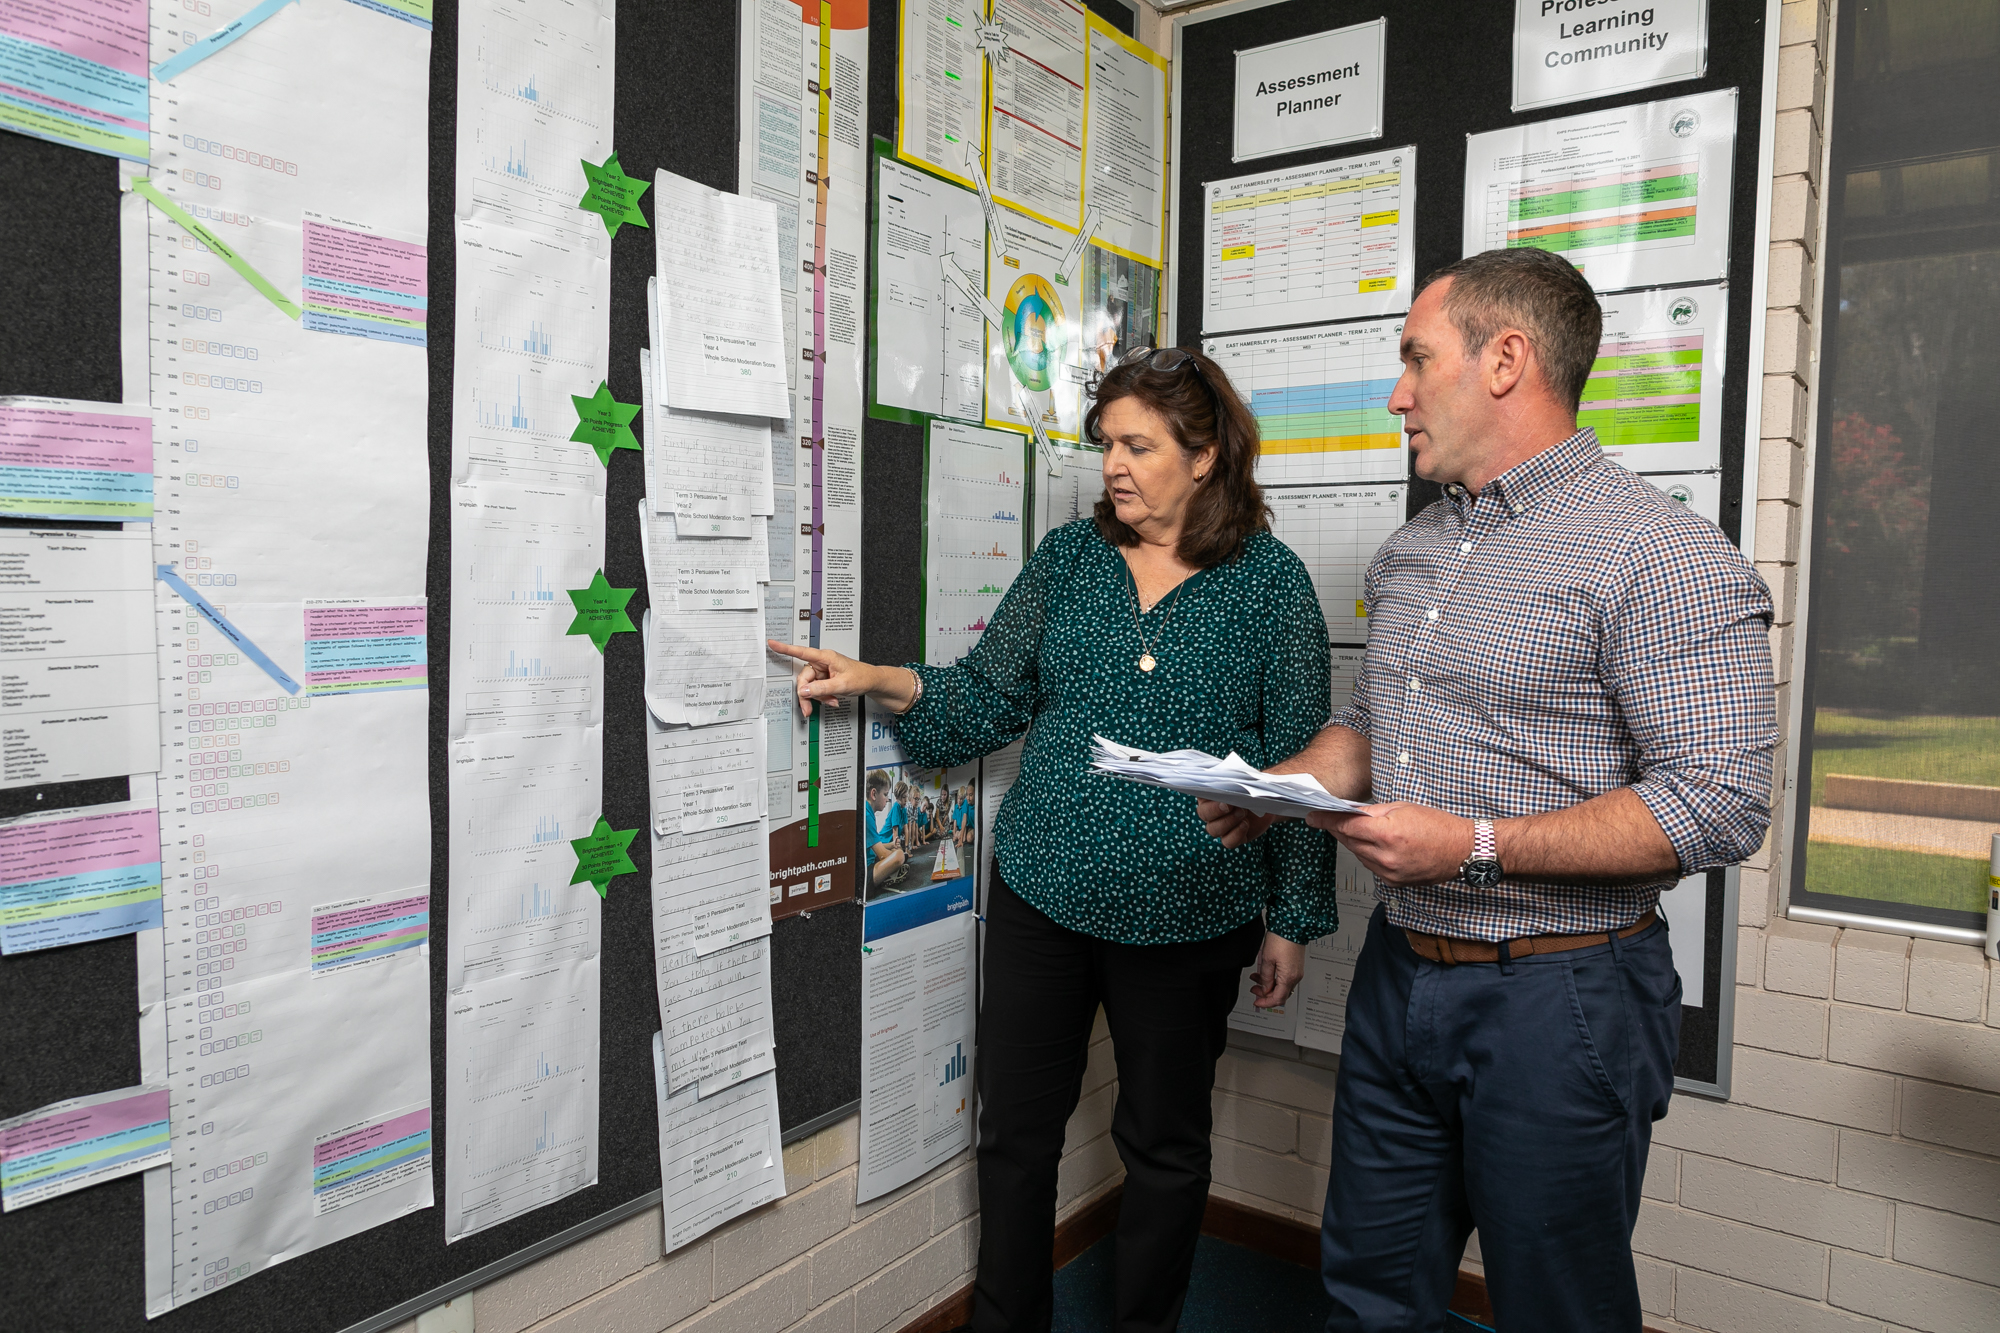
I first came across the concept of a data wall back in 2012, when reading the seminal text, Putting FACES on the data, by Lyn Sharratt and Michael Fullan. Thanks to their work, data walls are commonly discussed in education. For those of you who are unfamiliar with the concept, a data wall is a display of student achievement data, designed to help teachers focus on the success of every student. As one blog put it, ‘A data wall unites a school by bringing a staff together to see students as ‘our students’ versus his or her students’.
5 features of an effective data wall
-
The data wall uses sound data that facilitates good decisions about student learning.
-
The display provides a perspective or view of student achievement that teachers would not ordinarily have.
-
The data displayed show student growth in learning.
-
The data wall contributes to more effective teaching and thus, improved student learning.
-
There is a clear line of sight from the data wall to teaching plans and to feedback to students.
In 2016, Sharratt advised that data walls need to advance from stilted snapshots of performance, to being evidence of problem-solving strategies agreed upon by all teachers who teach each student. She went on to state, ‘Data walls MUST show growth and achievement.’
In her 2016 article, Sharratt cautioned against pretty displays for the sake of pretty, and advised,
‘Data Walls become more in-depth when the assessment tool used to put the FACES on the data is teacher developed, focused on student work and collaboratively assessed to agree upon levels of the work. The documentation of this work invites inquiry into students thinking and raises questions for teachers and leaders about best, high yield instructional practices for all students: necessary for some – good for all.’
But schools are busy places and time is a precious commodity. Even if a school dispenses with ‘pretty’, creating an effective data wall takes a lot of time.
Using Brightpath data for your data walls
We would like to share with you how we support school leaders and teachers with collecting sound data about student achievement and help them use that data to improve student learning.
Brightpath Assessment and Reporting software provides:
-
Fully developed scales to assess narrative, persuasive, information report and recount writing, for students from kindy to year 9.
-
An extensive range of online mathematics assessments for students in year levels 2 to 9.
-
A broad range of reports that support both formative and summative uses of the data.
-
The facility to track student growth in learning in terms of learning progressions.
A view of students’ performance against next step teaching points
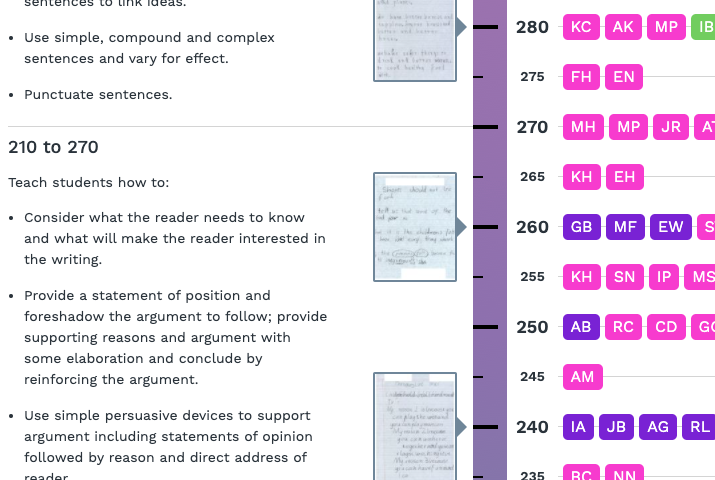
Figure 1 (below) shows an extract of a Teaching Point report for narrative writing. This report displays students’ scores relative to learning progressions and provides information about what students need to learn next. Each block represents the score a student was given, and the student’s initials are shown within the block. Each year level is depicted in a different colour. As you can see, such a report makes it easy for schools to work from the data to teaching programs to feedback to students.
‘Brightpath has led to improvements in writing because we have that, detailed clear feedback. It tells us exactly what students need and what to work on.’ School Curriculum Leader, East Hamersley PS
Figure 1: Extract of a Teaching Point Report for Narrative Scale
A view of whole school data
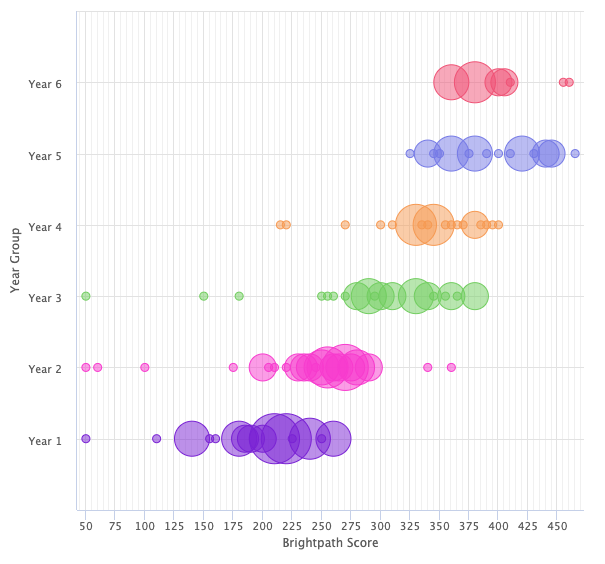
The Brightpath scales are equated so schools can readily see students from different year levels on the same scale. Figure 2 (below) shows an example of whole school data. Each year level is shown in a different colour, but all students have been scored on the same scale. The size of the bubbles represents the number of students with a given score. Outliers, student that over or underperformed significantly, are easy to identify.
Figure 2: Bubble Distribution Display, Persuasive Scale, Term 3, 2021, East Hamersley PS
Student growth in learning
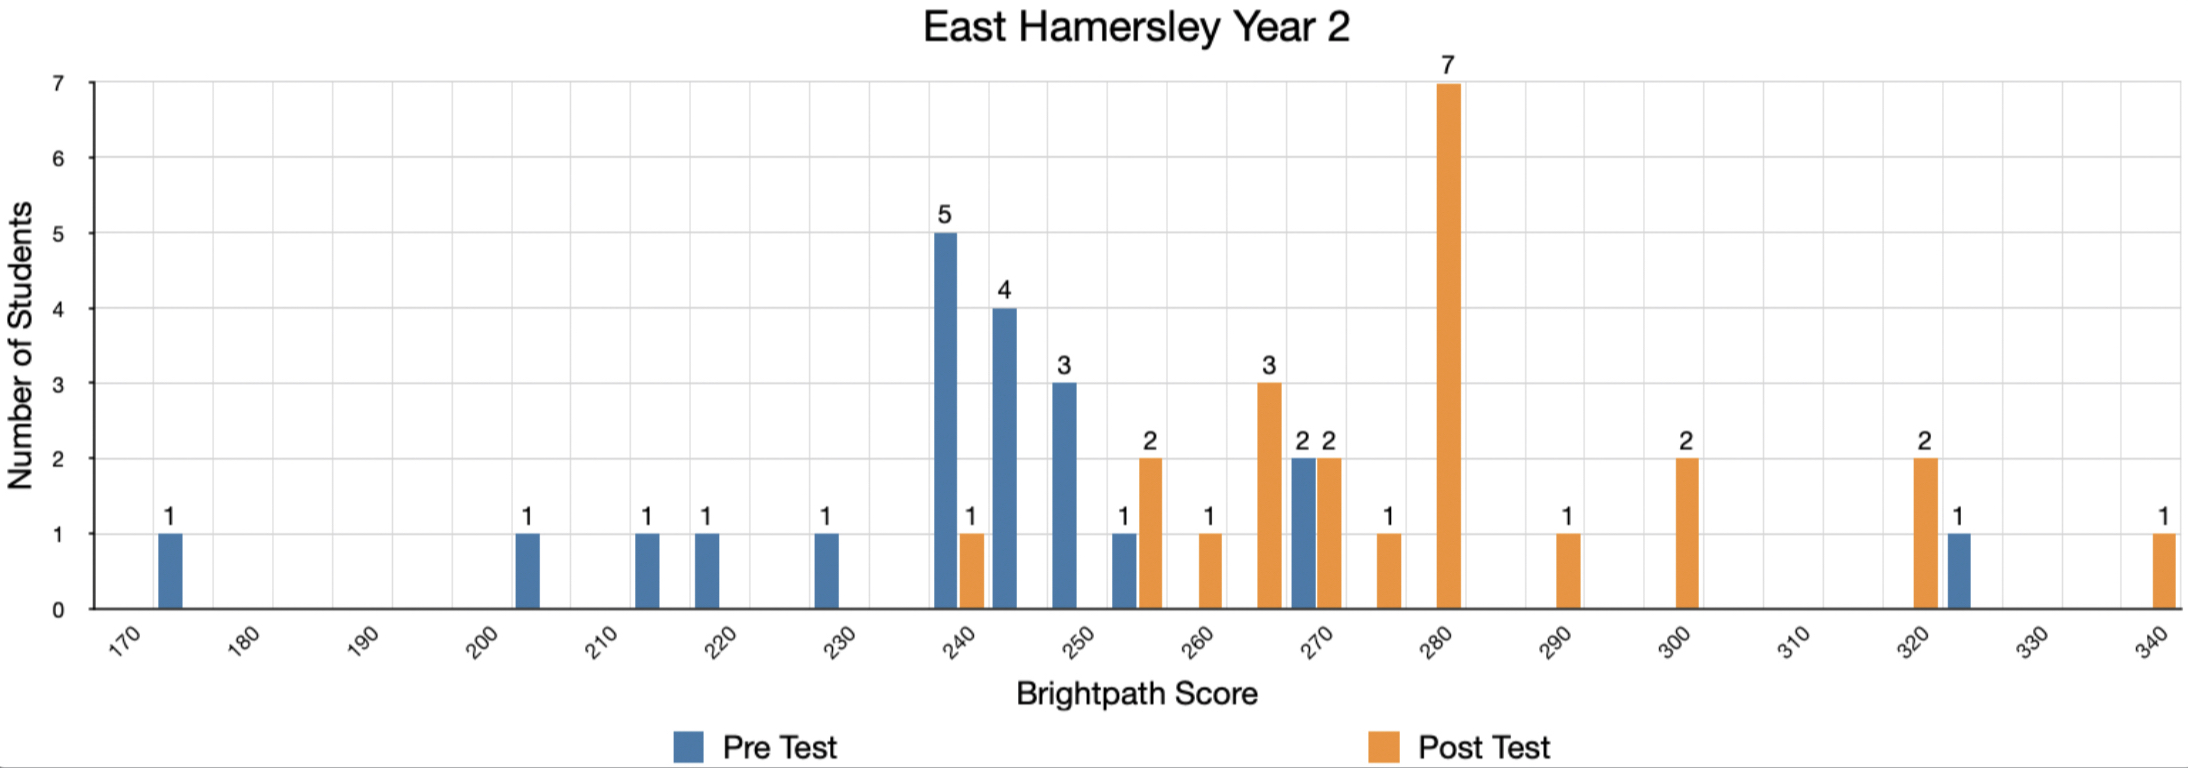
As teachers place students’ writing on the same scale over time, and because the all the mathematics assessments have been scaled, it’s easy for teachers to evaluate student growth in learning. Figure 3 (below) shows the pre- and post-test data for year 2 students who were assessed first in Term 1 and then again in Term 4 on the narrative scale. The blue histogram shows the distribution of students the first time they were assessed, and the orange histogram shows their distribution the second time they were assessed. As you can see, Brightpath makes it very easy for teachers to evaluate how effective their teaching has been.
Figure 3: Pre- and post-test distribution for narrative writing, Year 2, Term 1 and 4, 2020, East Hamersley PS
References
Sharratt, L. & Fullan, M. (2012) Putting Faces on the Data; What Great Leaders Do! Corwin, USA.
Sharratt, L. (2016) Data Walls: Living Wallpaper! Accessed: https://www.lynsharratt.com/post/data-walls-living-wallpaper
This article is Article 1 of a 5-part series, ‘Learning from the Experts.’