Our research examining rubrics to assess writing
Every now and again teachers will tell me they prefer using their own rubric to assess their students’ writing (which they have devised by extracting information from the Australian Curriculum and/or the WA Judging Standards documents) rather than using Brightpath. Those of you who have studied with Steve Humphry and me, will know of our research examining the rubric in the WA Literacy and Numeracy Assessment (WALNA).
I thought I would provide a synopsis of our research here as there is never enough time for me to explain to those teachers who greatly value rubrics why I am cautious about rubrics.
Context for our research
Our research arose from the full-cohort testing program that was introduced in Western Australia in 1999, following a decision from the State and Federal Ministers of Education that all students aged approximately 7, 9 and 11 would be assessed in reading, writing, numeracy and spelling. It was also agreed that the tests would be the responsibility of each of the eight States or Territories in Australia.
As many of you will remember, in 1999 WA had a mandated Curriculum Framework which included an Outcomes and Standards Framework (OSF). The OSF described the typical progress students made in each of eight learning areas. Learning in these areas was described in terms of eight stages, which we referred to as levels.
Devising a rubric to assess writing
With the introduction of full-cohort testing, a rubric for the assessment of narrative writing, an aspect of the English OSF was created. This rubric consisted of nine criteria. Markers were required to make an on-balance judgement as to the level (1-8) of each student’s performance overall and then they were required to assess each performance in terms of spelling, vocabulary, punctuation, sentence control, narrative form of writing, text organisation, subject matter and purpose and audience.
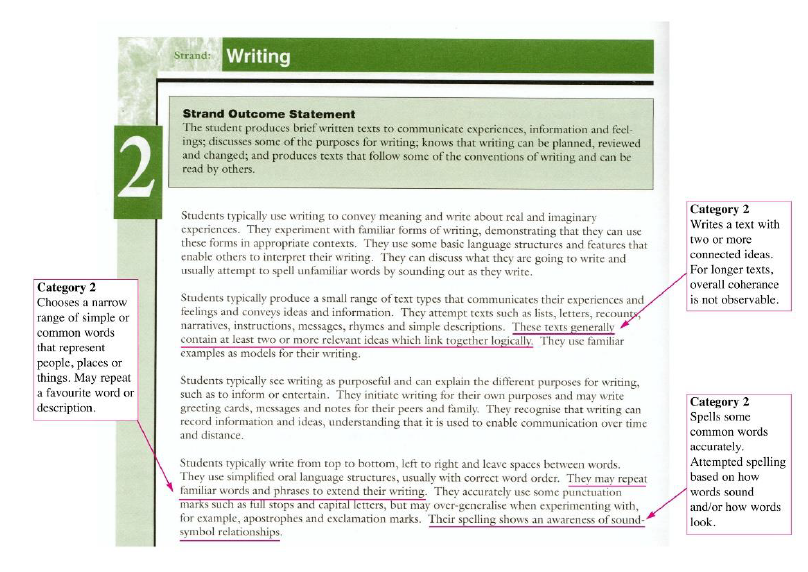
The category descriptions within each criterion were derived directly from the OSF (shown in Figure 1). That is, the description used to determine a score of 2 in spelling, was taken directly from the description of level 2 performance in the OSF, the description for a score of 3 for was taken directly from the level 3 description in the OSF, and so on. The number of categories for each criterion is shown in Table 1.
Table 1: Original classification scheme for the assessment of writing
| Aspect | Score Range | Aspect | Score Range |
|---|---|---|---|
| On balance judgement (OBJ) | 0 - 8 | Form of Writing (F) | 0 - 7 |
| Spelling (Sp) | 0 - 5 | Subject Matter (SM) | 0 - 7 |
| Vocabulary (V) | 0 - 7 | Text Organisation (TO) | 0 - 7 |
| Sentence Control (SC) | 0 - 7 | Purpose and Audience (PA) | 0 - 7 |
| Punctuation (P) | |||
| Total Score Range | 0 - 61 |
This marking rubric was very much liked by the approximately 300 teachers who meet each year at a central location to mark the students’ narrative writing. When the marking rubric was presented at teachers’ professional development seminars it was also well received. Steve however identified issues relating to the psychometric properties of the data obtained from this assessment, the most tangible being the distribution of student raw scores.
Figure 1: Extract from the Outcomes and Standards Framework showing how the Western Australian marking guide was originally derived
Early identification of a possible issue
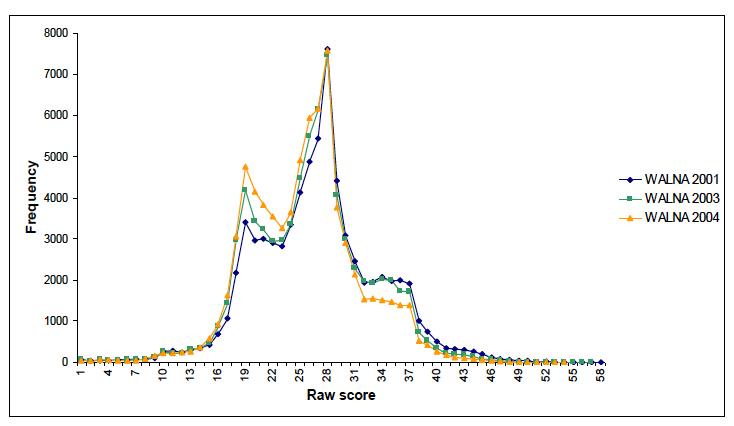
Figure 2 shows the raw score distribution of year 3, 5 and 7 students in 2001, 2003 and 2004. It can be seen firstly that the distributions remained relatively stable over the period (2001 -2004). This stability was achieved through the training of markers and in particular through the use of exemplar scripts, rather than by applying post-hoc statistical procedures.
Secondly and most importantly the graph shows that although there is a large range of possible score points (1 – 61), the distribution clusters on a relatively small subset of these (in particular scores around 18, 27 and 36). In effect, we were classifying students into three broad groups, as the predominant scoring pattern was all 2s, or all 3s, or all 4s across the nine criteria.
Investigating why students’ scores clustered
Initially we were uncertain if the issue of clustering of performances related to the nature of writing development, itself, or if it was related to artificial consistencies introduced by the marking guide. To better understand this, we set up a series of studies in which we tested several hypothesises.
The first hypothesis was that the marking of all aspects of a piece of writing by a single marker generated a halo-effect. For example, weak spelling influenced the judgements on all other criteria. The second hypothesis was that the structure of the rubric itself led to artificial consistencies in the marking. The third hypothesis was that the descriptions of the qualitative differences, as captured in the categories for each criterion, were relatively crude. We found that all three factors contributed to the clustering on a small subset of score points, and that these factors were interrelated. I provide a brief synopsis of how we tested each hypothesis below.
Figure 2: The raw score distribution of year 3, 5 and 7 students narrative writing as assessed through the Western Australian Literacy and Numeracy Assessment in 2001, 2003 and 2004.
Hypothesis 1 – Halo effect
Our first hypothesis was that the marking of all aspects of a piece of writing by a single marker generated a halo-effect, especially in the context of the on-balance judgement of the level of performance. That is, the same judge would tend to give the same level on all aspects more than different judges would if they each marked a separate aspect.
This hypothesis was tested by having each marker mark only one aspect of a performance (for example, only spelling, or only sentence control) and not allowing them to see how the other aspects of the performance were marked. The results of this study showed that a halo-effect did to some extent cause artificial consistency in the marking.
Hypothesis 2 – Artificial consistencies created by the rubric itself
Having removed the halo-effect, yet still observing artificial consistency we concentrated our studies on analysing the rubric itself and it became apparent that aspects of the rubric overlapped logically and semantically. Table 2 shows an extract taken from the marking guide and it can be seen that a student who writes a story with a beginning and a complication would be scored two for the criterion, form of writing. This student will necessarily have demonstrated some internal consistency of ideas (category 2, subject matter). Similarly, if a student who has provided a beginning and a complication, he or she has most probably provided a narrative that contains two or more related connected ideas (category 2, text organisation).
Table 2: Extract from the narrative marking guide shows semantic overlap of criteria
| Category 1 | Category 2 | |
|---|---|---|
| Form of writing | Demonstrates a beginning sense of story structure, for example opening may establish a sense of narrative | Writes a story with a beginning and a complication. Two or more events in sequence. May attempt an ending. |
| Subject matter | Includes few ideas on conventional subject matter, which may lack internal consistency. | Has some internal; consistency of ideas. Narrative is predictable Ideas are few, maybe disjointed and are not elaborated. |
| Text organisation | Attempts sequencing, although inconsistencies are apparent. | Writes a text with toe or more connected ideas.For longer texts, overall coherence is not observable. |
Based on this work, the marking rubric was refined by removing all semantic overlap. The results from this second series of studies showed that the semantic overlap did also to some extent cause artificial consistency in the marking.
Hypothesis 3 – Rubric provided relatively crude descriptions of performance
A third source of artificial consistency was investigated – that of the relative crudeness of classification. As I explained earlier the marking rubric was derived directly from the levels of performance described in the Outcomes and Statements Framework (OSF). The explanations that accompanied the introduction of the OSF was that the average student would take approximately 18 months to progress through a level. The levels therefore do not describe and are not expected to describe fine changes in student development.
The statistical analysis of the data provides the opportunity to examine the relationship between levels (as depicted in the marking rubric) and student ability. Figure 3 is taken from the analysis of the writing data and shows that within a wide ability range, a student would have a high probability of being scored similarly on each criterion. For example, students within the ability range of -3 to +1 logits would have a high probability of scoring all 3s, whereas students in the ability range of +1 to +6 logits would have a high probability of scoring all 4s. Based on the mean scores of students of different age levels, these ability ranges equate to approximately two years of schooling.
Figure 3: Threshold Map showing the relationship between ability and the probability of a score for each criterion
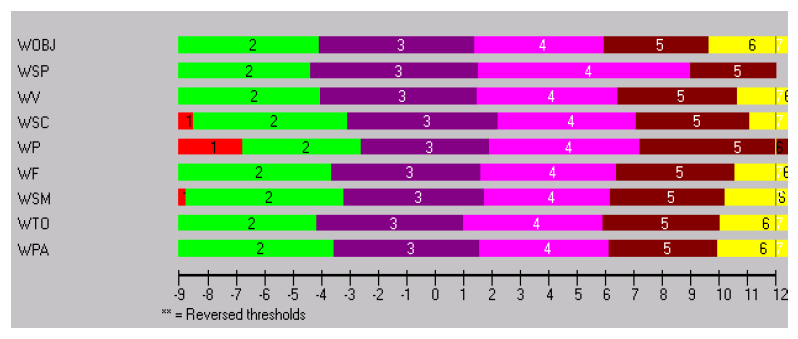
Although the marking rubric contained many criteria, and therefore many score points, it provided only relatively few thresholds, or points of discrimination. Essentially all the information about student performance was obtained from the overall judgement, the on-balance judgement of the student’s level. All other judgements were replications of that judgement.
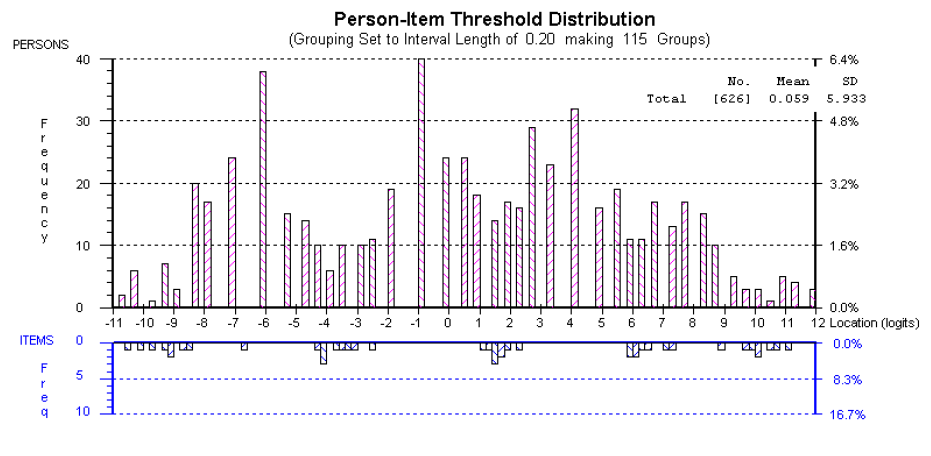
Figure 4 provides another way of looking at the data. The graph shows the distribution of persons (students) in relation to the thresholds (or points of discrimination between successive categories) provided in the rubric. The horizontal axis shows the distribution of persons (above) and the distribution of thresholds (below) on the same scale. You will notice that where there are gaps between successive thresholds, the student distribution tends to form clusters.
An analogy to timing a long-distance race may help in explaining this phenomenon. Imagine that you are timing students as they come across the finish line but that your stop watch only records in minutes and not in seconds. Although students cross the line at varying times, you can only record that they took 3 minutes, 4 minutes, 5 minutes and so on, thus in drawing a distribution of students across times, there will be ‘clumps’ of students at 3, 4 and 5 minutes and gaps between these time intervals.
This is what was happening with the rubric. Over and above the issues related to the halo effect and the semantic overlap, the marking rubric did not capture the fine changes that can be observed in student writing development. Although there were qualitative differences between the students’ written performances, our markers could classify the students only into three or four relatively crude groupings.
Figure 4: Distribution of students in relation to the thresholds provided in the rubric
Summary of findings
The findings from our studies showed that the marking rubric provided only coarse descriptions of student writing development because we had derived these from broad descriptions of performance. As a result, student performances could be classified into only three or four score groups, with relatively large gaps between these scores. Semantic overlap between criteria and the influence of the on-balance judgement further exacerbated the issue.
Devising a rubric to obtain fine-grained information about student growth
At this stage, we were still uncertain as to whether this finding was particular to writing development. Did writing ability only manifest as broad or wide qualitative changes in performance?
Based on an analysis of our findings, we hypothesised that the general level of description in the framework of how student learning develops did not provide the level of detail we needed for a marking rubric of students’ narrative writing. The framework made no mention of character and setting for example, and it did not articulate in fine detail how students’ sentence level punctuation or punctuation within sentences develops.
To test if this was in fact the case and that it was possible to devise a rubric that captured finer gradations in performance, we devised a new marking guide.
The new guide emerged from a close scrutiny of approximately one hundred exemplars. These were exemplars we knew very well as they had been central in the training of markers on the old guide. We compared the exemplars, trying to determine whether or not there were qualitative differences between them and trying to articulate the differences that we observed. Not all of the criteria we trialled worked as we had intended. For example, in weaker performances we identified a difference between those performances that had a sense of an oral register and those performances that had successfully adopted a written register. This qualitative difference however was not borne out by the trial data.
We found it very difficult to adequately describe development in students’ control and structuring of sentences. Theoretically, we classify sentences as simple, compound and complex, but we found that this classification does not represent the qualitative differences between students’ use of sentences. Immature writers may attempt to use complex sentences but they make errors. More mature writers may use simple sentences to effect. We conducted a separate study to determine the underlying developmental continuum in relation to students’ structuring and control of sentences.
I want to re-iterate that the rubric emerged from the scrutiny of these performances and the descriptions of qualitative differences between the performances. We had no preconceived notion of how many qualitative differences there would be for each criterion, or that there would necessarily be the same number of qualitative differences for all criteria, thus the number of categories for each criterion varied depending on the number of qualitative differences we could discern.
For example, in vocabulary and sentence structure there are seven categories because in a representative range of student performances from years 3 to 7, seven qualitative differences could be distinguished and described. In paragraphing however, only 3 qualitative differences could be distinguished so there are only three categories (0,1,2). Table 3 shows this revised classification scheme.
Table 3: Revised classification scheme for the assessment of writing
| Aspect | Score Range | Aspect | Score Range |
|---|---|---|---|
| On balance judgement | 0 - 6 | Punctuation within sentences | 0 - 3 |
| Spelling | 0 - 9 | Narrative Form | 0 - 4 |
| Vocabulary (V) | 0 - 6 | Paragraphing | 0 - 2 |
| Sentence Structure | 0 - 6 | Character and setting) | 0 - 3 |
| Punctuation of sentences | 0 - 2 | Ideas | 0 - 5 |
| Total Score Range | 0 - 46 |
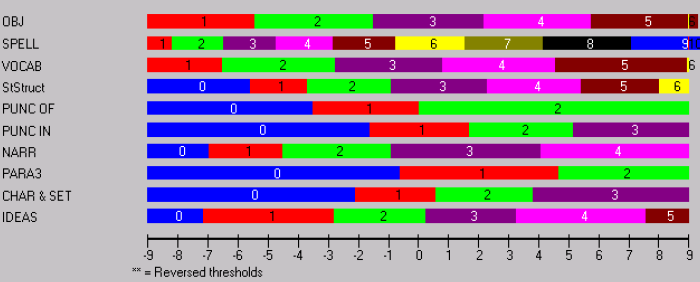
The threshold locations from the analyses conducted using data derived from the new guide are shown in Figure 5. You can see that a student, who was assessed in the on-balance judgement (OBJ) as being level 2, has a probability of being scored 3, 4 or 5 for spelling, or being scored as either 2 or 3 for vocabulary and so on. As the rubric has categories which were not aligned we had removed the issues associated with the halo-effect. More importantly as each category describes empirical qualitative differences in performance, each score point provides meaningful information about student development.
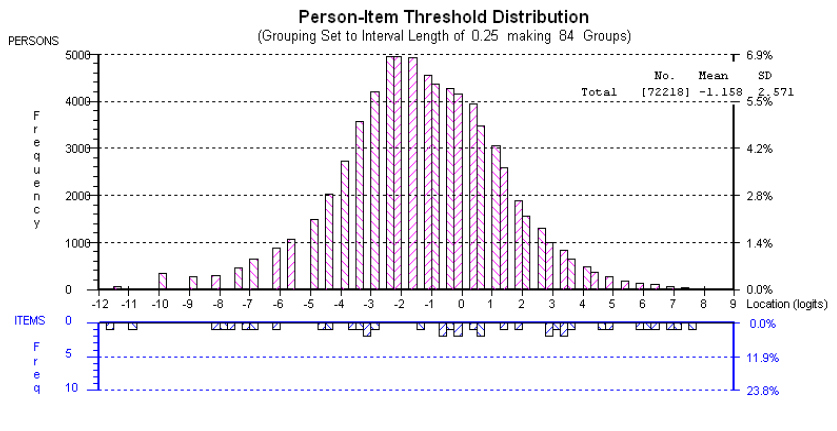
The person/item distribution generated from marking with the new guide illustrates this point (Figure 5). You will notice that the thresholds are distributed more evenly across the continuum and as a result the person distribution is more continuously distributed without the same peaks or clustering as shown previously. The more even distribution of thresholds from the different aspects, which arose from the careful scrutiny and articulation of the qualitative differences amongst the student performances, provides precision of assessment along the continuum.
Figure 5: Threshold Map for the new guide showing the relationship between ability and the probability of a score for each criterion
It may look as though we created a more complex and more time-consuming way of marking. The opposite is in fact the case. The marking became far quicker, less training was required and there was greater reliability in the marking. After training, to check marker reliability, all markers were required to mark the same set of twenty scripts. The analysis of this marking showed that 85% of markers had correlations of over 0.90 with the average marks of all markers for those scripts. It appears that because we had captured well the way in which narrative writing develops, the decision-making process involved in assessing a performance became considerably easier.
Figure 6: Distribution of students in relation to the thresholds provided in the new rubric
Implications of this research
-
The rubrics we developed, as a result of this research, was adopted as the NAPLAN rubric. Over time some aspects of the NAPLAN rubric have changed but the central conceptualisation has remained the same.
-
Our research contributed to WA withdrawing the Outcomes and Standards Framework.
More broadly this work spurred us on to explore the assessment process that is now used in Brightpath. At about the same time that we were concluding our research into the WALNA rubric, Steve and I were researching the pairwise comparison methodology. As you will already be aware we found that when we gave teachers pairs of performances to compare and rank, the teachers were highly consistent in their relative ordering of the performances.
We considered researching a way of helping teachers devise high quality rubrics but decided that if we could devise a way of making pairwise comparisons accessible to teachers to use, this had the potential to be a more effective way of assessing.
More general implications
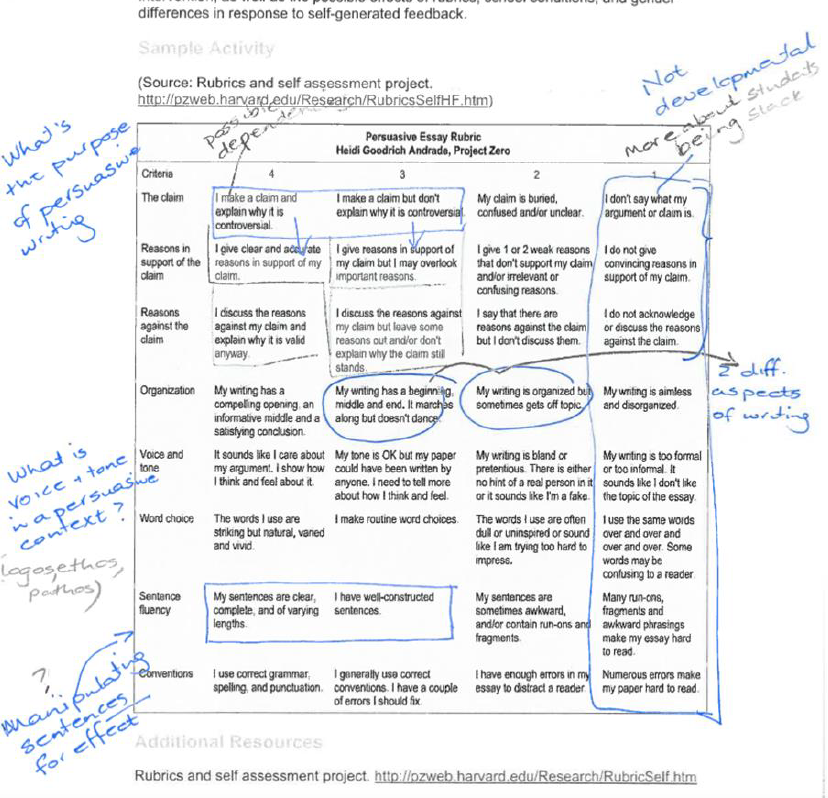
Steve and I reviewed a number of rubrics and we are confident the issue we identified in our research goes beyond the WALNA guide. Figure 7 shows my working notes as I examined a rubric designed to assess persuasive writing, published through Harvard University. I will briefly explain my thinking in case it helps you evaluate your own rubrics.
-
Category 1: My hypothesis is that the descriptions under category 1 are not describing a developmental stage, but are rather describing the features that relate to a student not engaging with the task. Some of our weakest year 3s set out what their argument is, be it in a very limited way.
-
Criteria – Organisation: My analysis is that description of organisation is capturing different aspects of writing. A beginning, middle and end is central to text organisation, but it marches along but doesn’t dance is not about organising a text.
- Criteria – Sentence fluency: It is perhaps here that we need to consider not only the sentence structure but also how students manipulate sentences to give their writing pace and to sway their reader; how they use repetition and alliteration to enforce their point.
- What’s missing: The rubric does not refer to the modes of persuasion used to convince the reader. These include ethos (ethical appeal), pathos (emotional appeal) and logos (appeal to the logic). Successful use of these modes are key indicators that students are demonstrating more advanced persuasive writing ability. There is no acknowledgement that students might use simile, comparison, and irony, for example, to advance their argument.
Figure 7: My working notes as I analysed the rubric
Implications for schools
For many subjects or aspects of learning rubrics are still about the only option available to teachers. Based on our research my advice is:
-
You need to draw on your depth of understanding of the learning area content when devising your rubrics.
-
Curriculum documents might help you think about what should be in a rubric, but these documents are broad organising documents and are therefore unlikely to include the detail that will allow you to make fine-grained distinctions between student performances.
-
If your rubric provides only coarse-grained information about student performance, not only is your assessment information limited but so too is the information that tells you what each student needs to learn next.
-
A way of evaluating whether your rubric is providing only coarse-grained information is to look at your students’ total scores. Are high proportions of students obtaining the same total score? When you review performances with the same total score can you identify that one is slightly better than the other? These are indicators that the rubric is not discriminating sufficiently well between students.
One further point
Words will always fail us. We have very limited language to describe the fine-grained changes in learning. Hence, we use words such as sometimes, mostly, simple etc.
When using Brightpath to assess, it is essential that you use the exemplars as the primary source of information about development. The descriptors help articulate key features of development but it is the comparison with the exemplars that provide reliable/consistent judgements.