How writing develops
Readers will know of the ongoing tussle in education.
- Should teachers be given a curriculum that sets out what students need to know at each year level?
OR
- Should they be provided with learning progressions that help them to understand learning as a sequence of stages in learning?
The later makes sense, doesn’t it?
But international attempts to depict learning progressions have come unstuck. One of the biggest hurdles has been with assessment and reporting student progress. In England, for example, it was found that teachers interpreted the progression levels differently, so it was hard to tell what students knew; teachers receiving new students frequently disagreed with the levels those students had been given by previous teachers; and too often levels dominated lesson planning.
It is therefore not surprising that many education systems have abandoned learning progressions and returned to stipulating what students need to learn at each year level. Yet for many teachers this is not satisfactory because it impedes them from teaching to their students’ point of need. Some of their students may not yet ready to learn the required content and others will have already moved beyond it.
Brightpath provides a way through, for writing at least. We believe that the data we have collected provide valuable insights for all schools and we are pleased to share these data with you.
Brightpath Learning Progressions
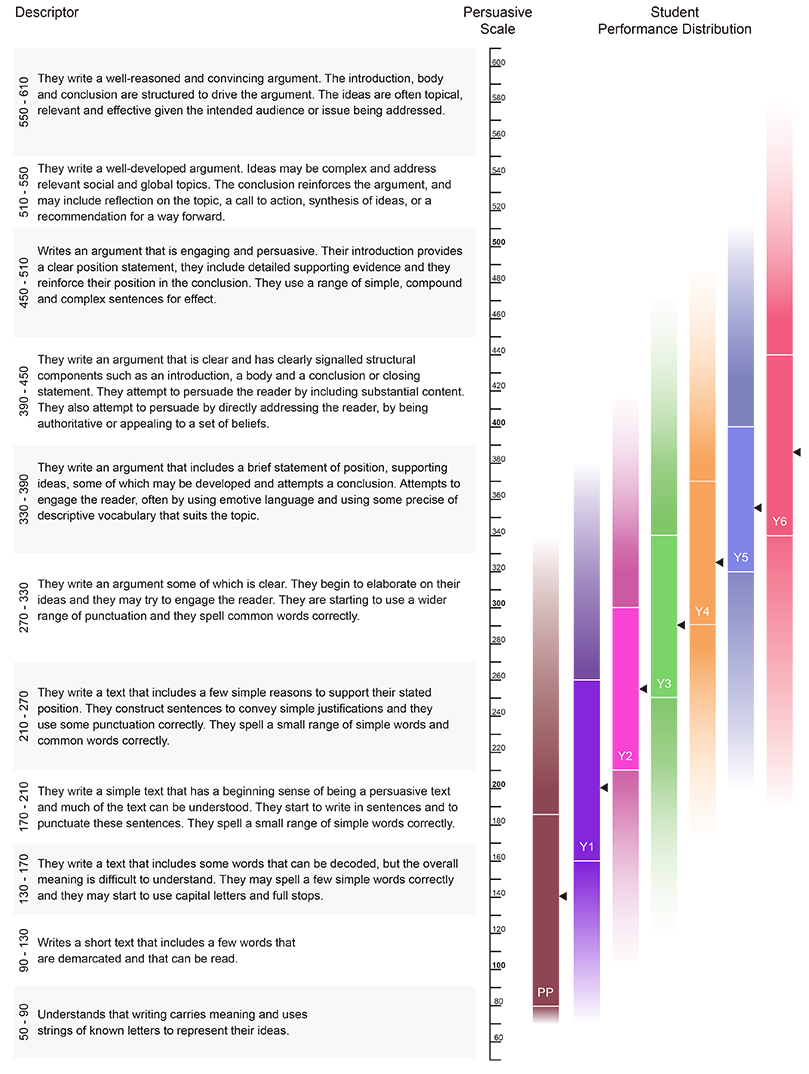
Figure 1 and Figure 2 below show our learning progressions for the narrative and persuasive scale respectively.
-
The scale in the middle of the display is the Brightpath scale.
-
To the left of the scale is an abridged version of the Brightpath performance descriptors. We develop these descriptions as part of our empirical work to calibrate writing scales.
-
To the right, we have plotted student achievement data for year levels Pre-Primary to Year 6. You will see we have plotted the distribution for each year level separately.
-
The black arrow shows the median score.
-
The central box shows the scores associated with 50% of students.
Figure 1 - Brightpath Narrative Learning Progressions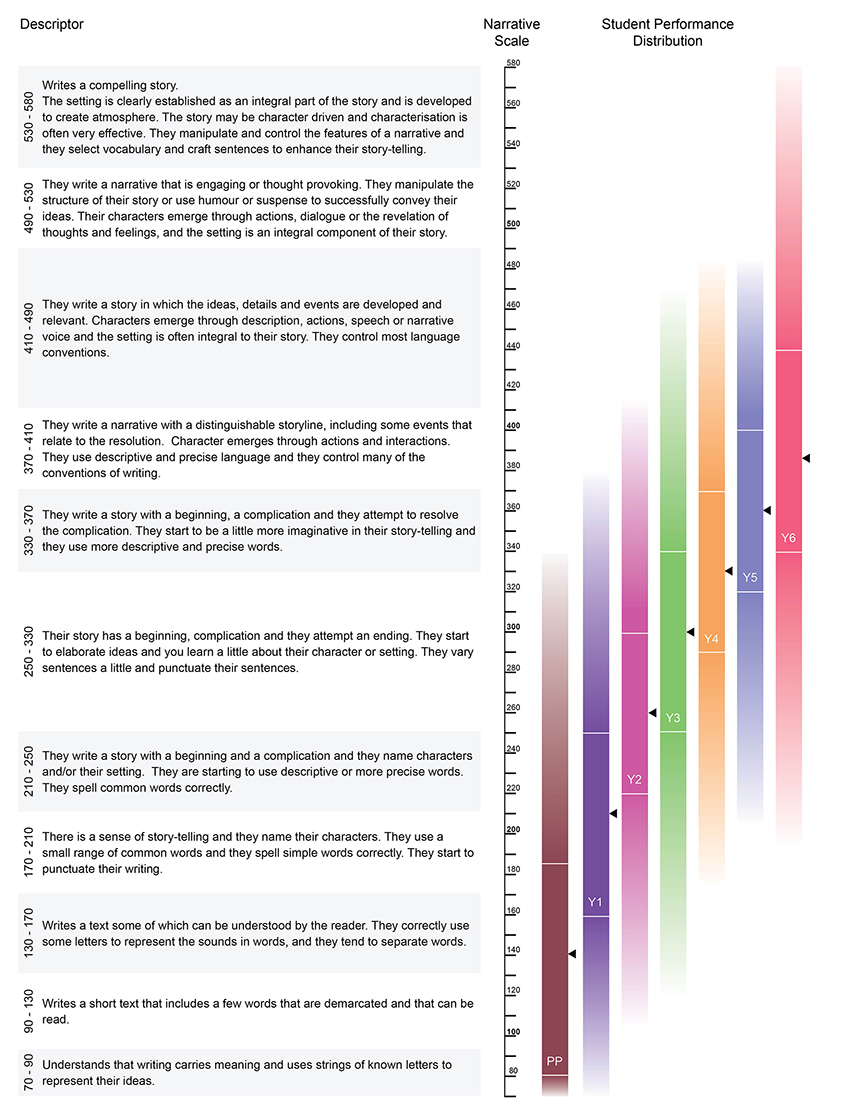
Figure 2 - Brightpath Persuasive Learning Progressions
You are welcome to download the Narrative Learning Progressions and Persuasive Learning Progressions as PDF. They will offer further explanation and give some key statistics.
How can teachers use this information?
From experience, we know these data can lead to valuable discussion about how writing develops, the range of ability within a year level, and the overlap of ability across year levels.
Here are some possible conversation starters:
-
Which aspects of the descriptors relate to the authorial aspects of writing (i.e. those aspects of writing where the author is free to manipulate language to achieve their purpose)?
-
Which aspects of the descriptors relate to the conventions of writing (i.e. those aspects of writing where the author has to follow rules)?
-
What is the relationship between the median score for each year level and the performance descriptors? i.e. What can an average Year 3 do?
-
What is the implication of the overlap of achievement across year levels, for your whole school planning?
-
What is the spread of ability in your class and how do you teach to students’ point of need?
-
How can you use this information to reflect upon and refine your school scope and sequence documents?
How does Brightpath work?
Teachers assess their students by comparing their performances to calibrated exemplars and they are immediately provided with next steps teaching points. As one teacher said, ‘We now have a tool to continuously monitor our students’ writing and we know what to do immediately after we have the results.’
Nearly 800 schools across Australia are using Brightpath to assess their students’ writing.